
Does your company use MS Power BI to gain insights in Business processes? Diagnostics can now help you leverage data from GE Smallworld. You can grasp the data from Diagnostics and make your KPI for the projects visible. Are you Quality requirements meeting the objectives? Are you improving your business?
Diagnostics leverages the underlying technical solutions of Splunk. Splunk provides an ODBC connector and with this connector you can open up your data. With this simple install procedure, you can leverage the Diagnostics data in Microsoft Power BI.
Install the driver for MS Power BI
Have your MS Power BI environment running. For example, the easiest installation: Power BI Desktop. You can also have the more advanced Power BI server but in that case, contact the Power BI server specialist for details.
Let’s assume you have the standard Power BI Desktop installation running for Diagnostics on GE Smallworld.
Now install the ODBC driver from Splunk on the machine running MS Power BI: https://splunkbase.splunk.com/app/1606/
Select the right version first (MS Windows or MacOS)
Only install this driver: install the ODBC driver.
Be sure to log in to your Diagnostics account. You need to create “saved queries” to access with MS Power BI.
Configure
Start MS Power BI Desktop.
Open a new data source by pressing “Get data”:
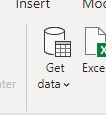
You will be shown all possible sources, and the ODBC driver is there too. Select it and select the “Splunk ODBC Data source name (DSN)”.
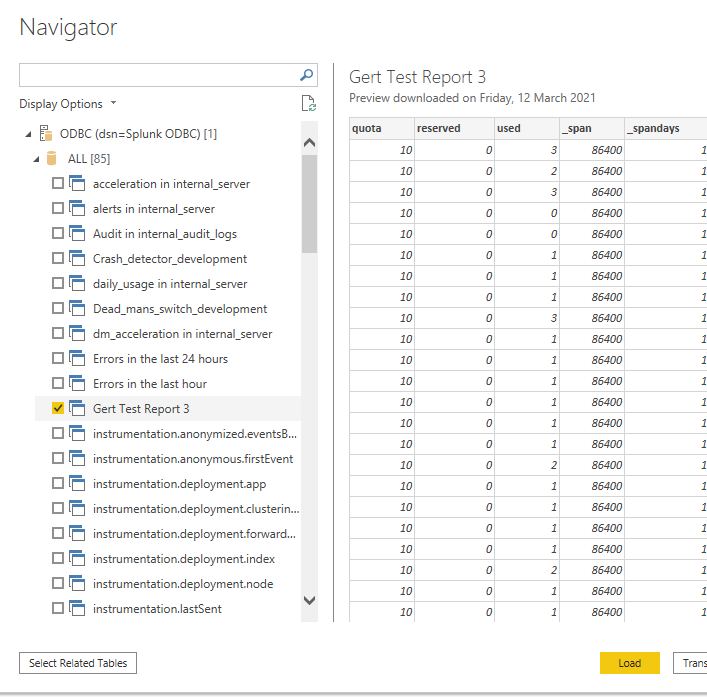
You now have the possibility to access all saved queries and reports from Diagnostics on GE Smallworld.
Example
I created an example for you:
First, I created a test query “Gert Test Report 3”
Then I select it for import data in Power BI and simply loaded it.
Now you can create your dashboard.
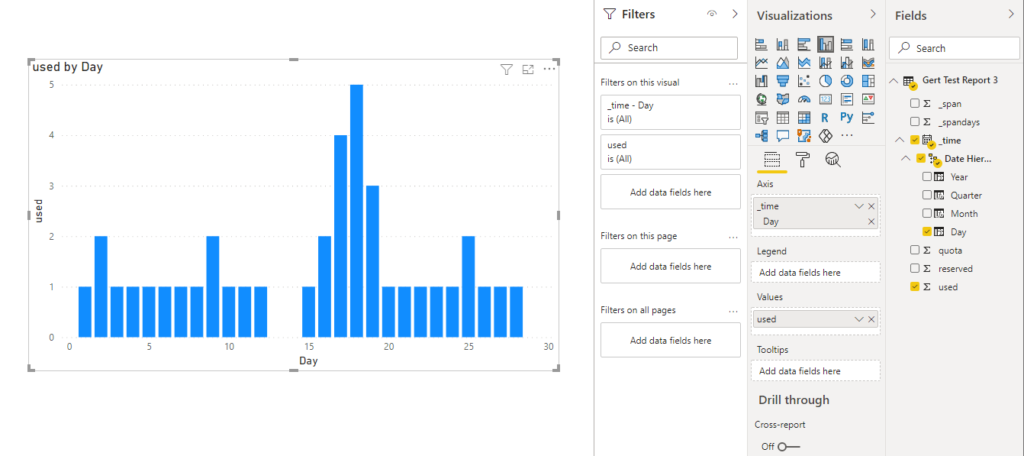
In the example, I added Day in the x-axis and number of used license in the y-axis.
And you have a simple dashboard representing the total number of used licenses in Smallworld. Now you can publish your dashboard to your Power BI gateway, MS SharePoint or MS Teams or where in your Microsoft ecosystem you want to present it.
You can easily create your own Saved Query or ask Realworld Software Products BV to help you setting up the right queries that feed your data need.
Reference and trademarks
Microsoft and Power BI: https://powerbi.microsoft.com/en-us/
Diagnostics: www.diagnosticsincontrol.com
Smallworld: https://www.ge.com/digital/applications/smallworld-gis-geospatial-asset-management
Splunk® : https://www.splunk.com/
Splunk ODBC 1: https://www.splunk.com/en_us/solutions/solution-areas/business-analytics/odbc-driver.html
Splunk ODBC 2: https://docs.splunk.com/Documentation/ODBC/3.1.0/UseODBC/AboutSplunkODBCDriver