Supporters: Alexandru Hesson, Arun Venugopal, Koen van Keulen
The SWEG Monitoring Dashboards provide real-time insight into the status of your syncs.
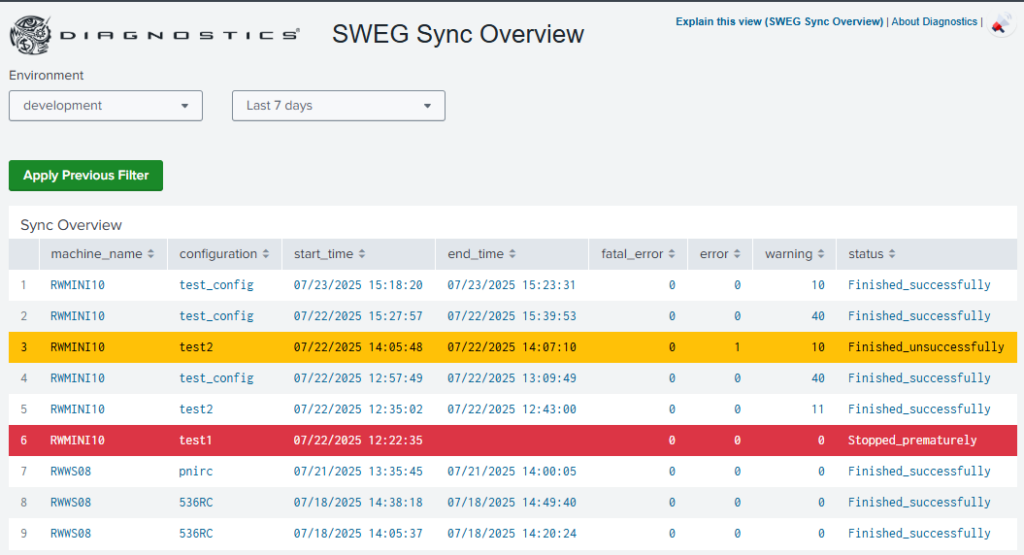
SWEG Sync Overview for all syncs
Users can now: • Monitor ongoing SWEG syncs in real-time • Access detailed sync history for better tracking and analysis • Receive instant feedback on sync performance and status
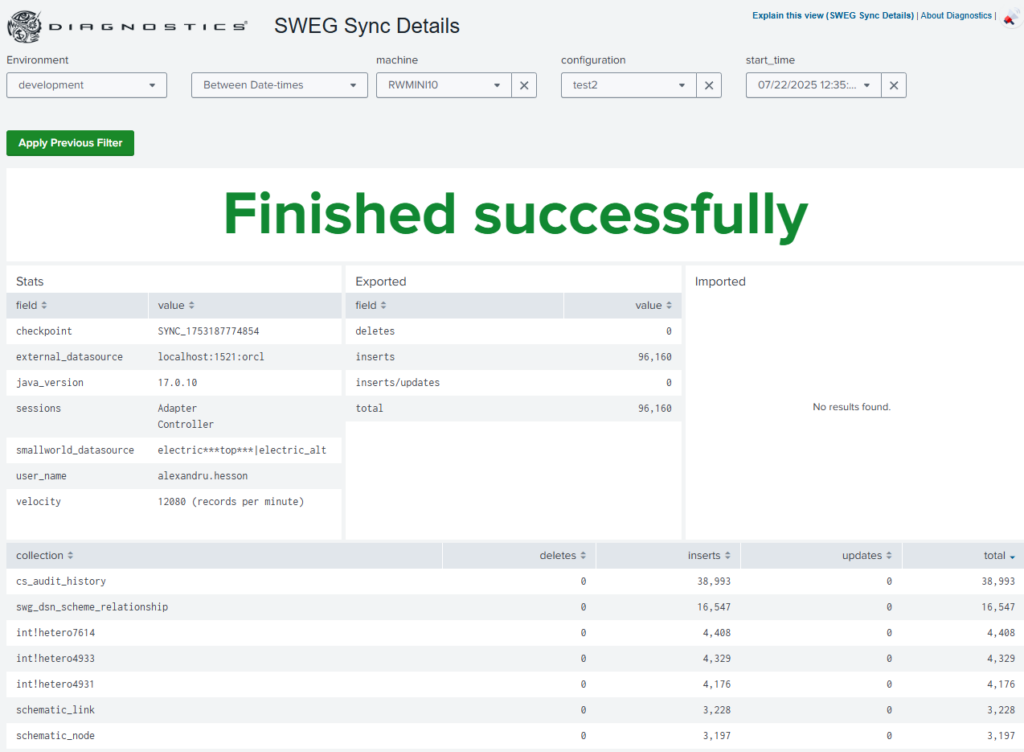
SWEG Sync Details – Finished Succesfully Status
For granular insights, individual SWEG syncs can be examined on the SWEG Sync Details Dashboard. This dashboard provides: • Additional context to support troubleshooting and analysis • Detailed sync status • Number of records and collections synced
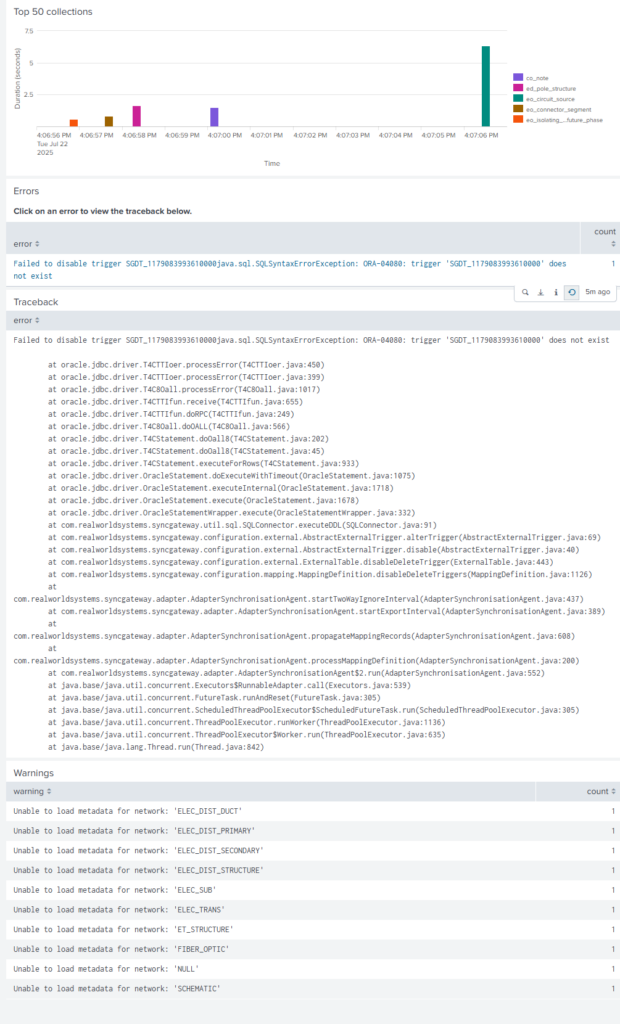
SWEG Sync Details – Errors and Warnings
The sync details dashboard also provides more data on any errors or warnings as well as recording the traceback for each of the errors. There is also a chart which shows which collections synced the slowest.
Administrators can monitor the Diagnostics dashboards with Diagnostics on Diagnostics. Get useful insights into which dashboards are used most or least often by your team, the actions taken on them, and how they perform.
The dashboard contains the following charts:
•Logged in users, Users List
•Viewed Dashboards count, Top 10 dashboards viewed by most users
The Short Transaction Server is by nature a bottle neck in a Smallworld system. Smallworld is based on Version Managed databases, that is long transactions, so short transactions are ugly duck between the beautiful swans.
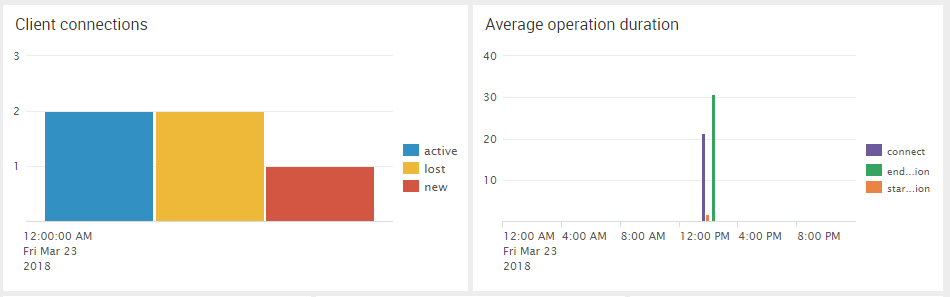
Number of Client connections and Average operation duration
A short transaction means you block the database for handling the atomic transaction. This means other transaction need to wait for the current transaction to finish. In the ideal situation you have no pending transactions.
This module provides you with all kinds of events related to the short transactions. Next to that Coen added some dashboards that provide insight in the duration and number of clients and transactions running on your short transaction server.
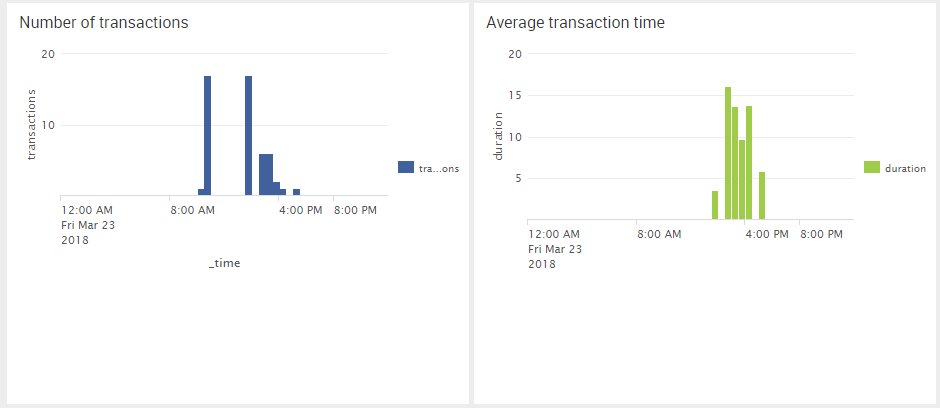
Number of transaction and Average transaction time
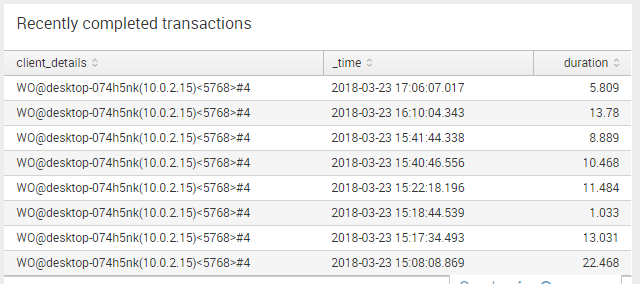
An overview of users connected to your short transaction is in a handy table
This custom module gives you the opportunity to monitor your job servers. In case you are using Design manager you get extra possibilities to retrieve related design meta data information.
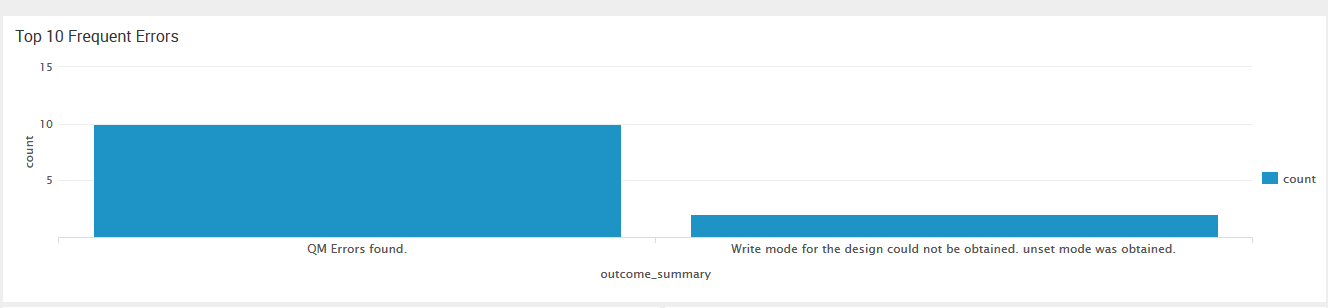
Top 10 Frequent Errors
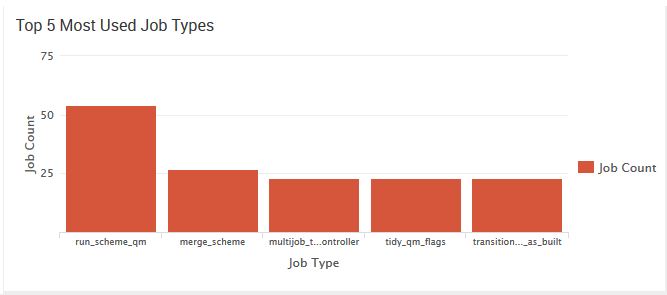
You get insight in jobs giving errors and numbers about usage of the jobs. The provided dashboards are sorted on job type.
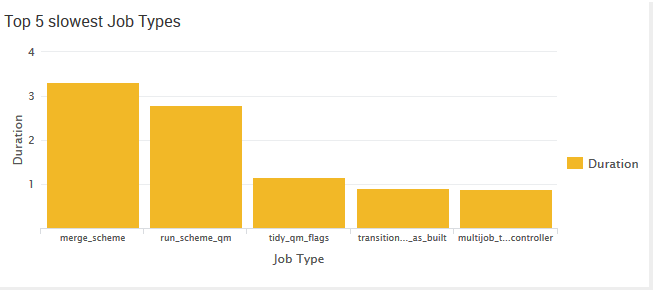
Top 5 Most Used Job Types
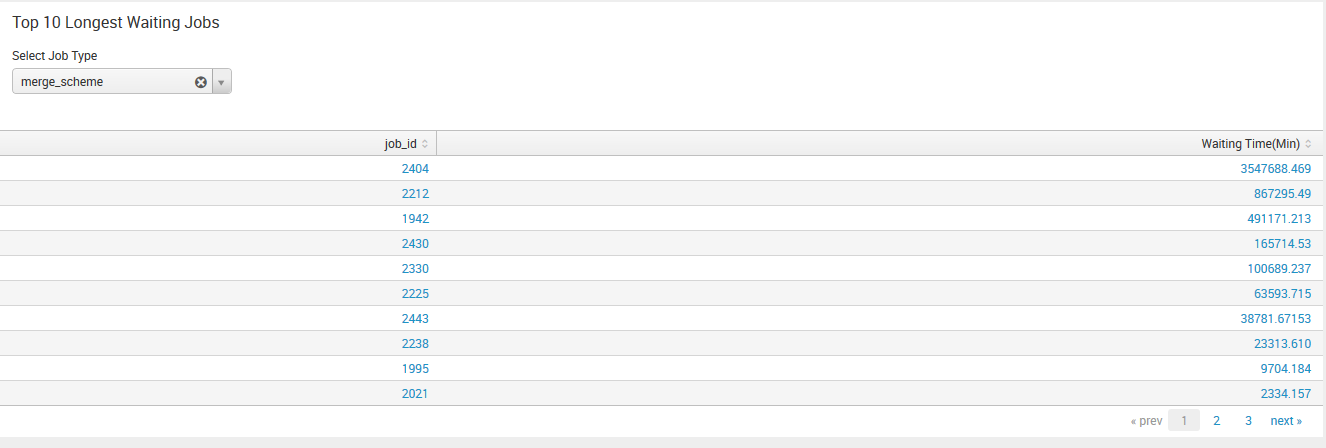
There is a possibility that all your job servers are busy performing tasks. In that case the jobs are queued. Ram added a dashboard showing the longest waiting times and also a possibility to find the job itself. This is sorted on a particular job type.
Top 10 Longest Waiting Jobs
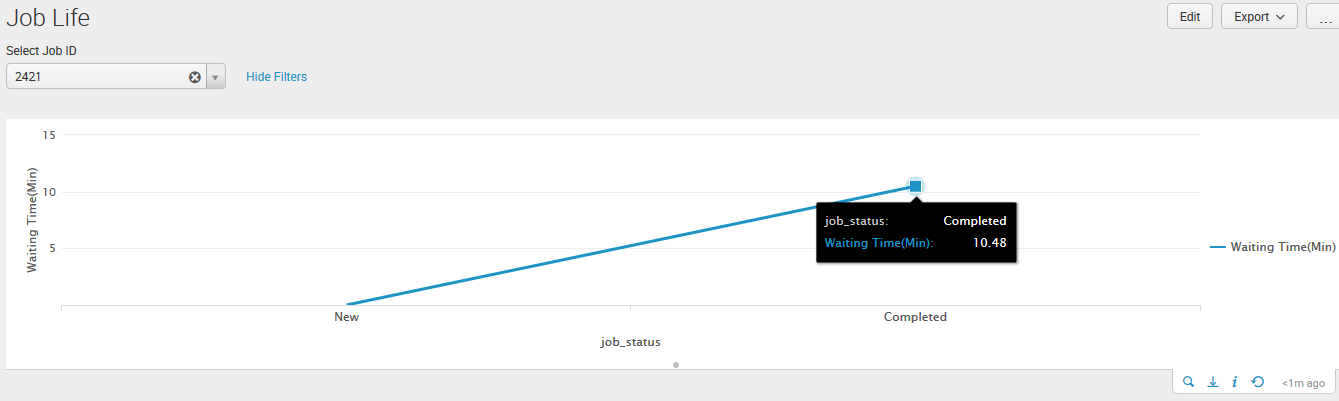
Detailed information about a particular job can be shown, called job life.
Job Life
Additional information from Design Manager
If you are using Design manager jobs are mostly related to design and the related process of changing design states.
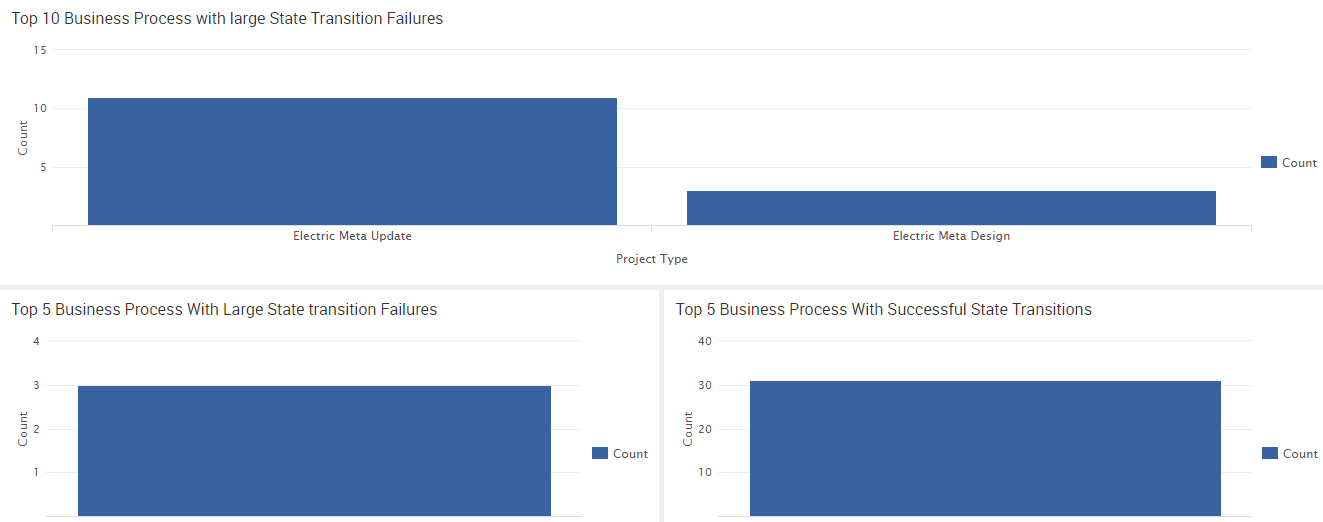
Top 10 Error Affected Business Process (State Model)
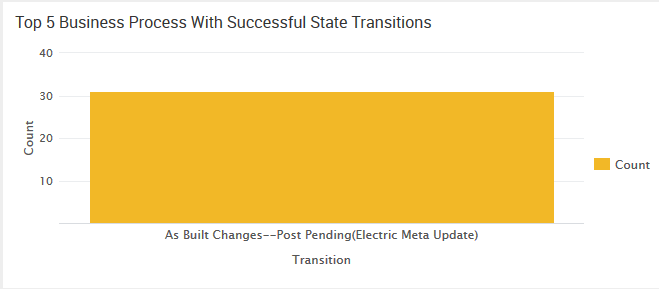
These screenshots give an idea of our development environment. For your own production environment these will expand to it full extent.
Top 5 Business Process With Successful State Transitions
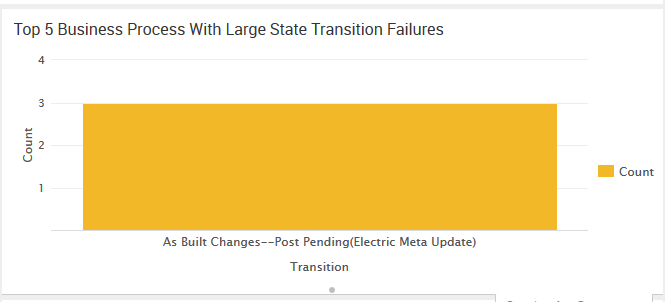
Top 5 Business Process With Large State Transition Failures
We really like to see your production screenshots. Please provide us with them so we can add them instead of our development pictures.
Please download and deploy both Job Manager modules. The system will figure out which one to load on your Job Manager installation.
IMPORTANT NOTE: The Superfile Monitor has been superseded by the Datastore Growth Monitor which is standard in the Diagnostics Product. The Datastore Growth Monitor is available from Diagnostics version 2.4.0 onwards.
Supporter: Diagnostics Competence Center; Ram and Gert
GE introduced the principle of superfiles in order to exceed the maximum allowed file sizes as defined by the file system.
Therefore, customers define a superfile structure that lasts for a long time. However, at a certain moment in time even this structure will fulfill the needs up to its extent.
This module aims to prevent the bad situation of running out of space and even worse into broken block headers.
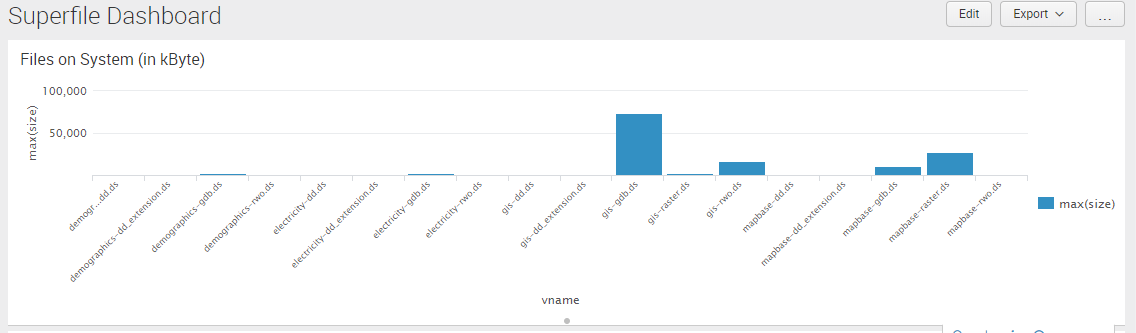
Superfile Dashboard for files on the system in kilobytes
The module reports two events: The status of the files and superfile components.
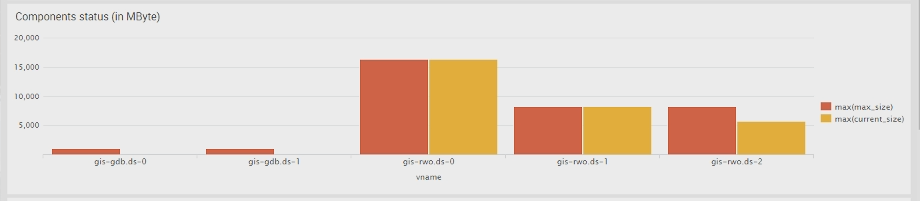
Status of the Components
These events are generated from the ds_file and the information given by the components as returned by the ds_file.
You can now see in one glance how your superfile definition is meeting your needs.
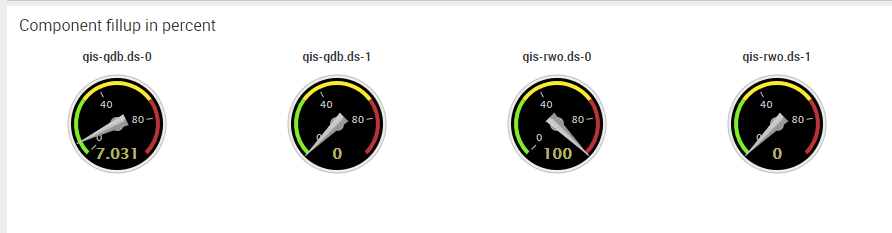
Percentage of the components filled
You can also create alert on certain situations:
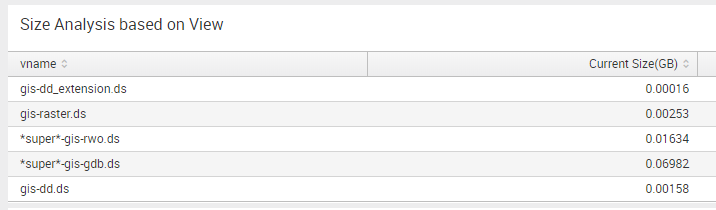
Size Analysis based on view
The expect time for running out of space is a good value for alerting.
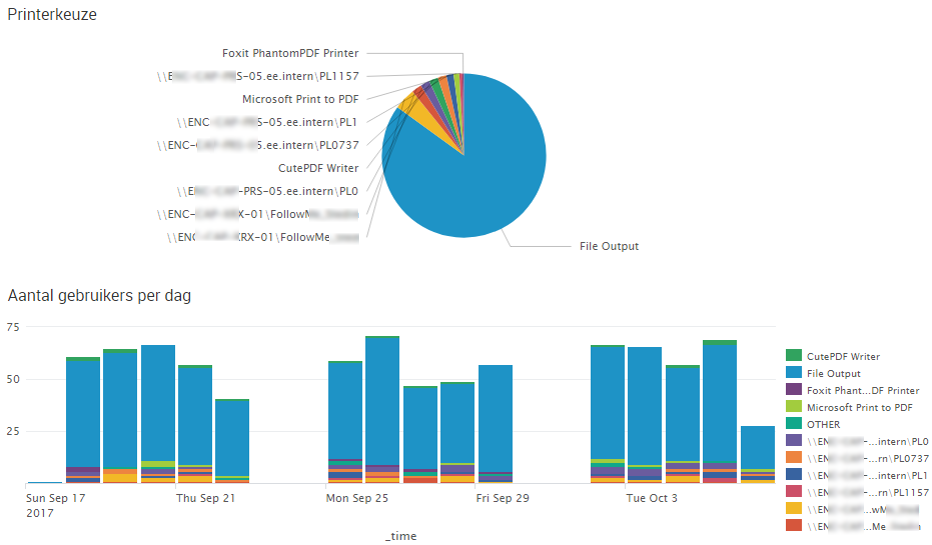
Stedin discovered through the use of Diagnostics that printing is still used more than expected. Due to this finding the custom module is designed to gain more insight in the way users are using printing from their Smallworld GIS.
This module gives extra insight in the Quality Manager and Design Manager but in the end the combination is very interesting.
Design Manager structures your process of designing new plans to as build. Design Manager follows strict the process in getting a Design to As Build. Many steps are supported by the Quality Manager to get the designs is a stage it follows all mandatory rules.
The Quality Manager can be downloaded (see below).
Design Manager
Design Manager Not Yet Reviewed
This module gives insight in the open projects, the duration of the projects and the time a project is in a certain stage. Below you see a screenshot of a overview over the kinds of projects the customer had defined.
Design Manager Analysis with QM
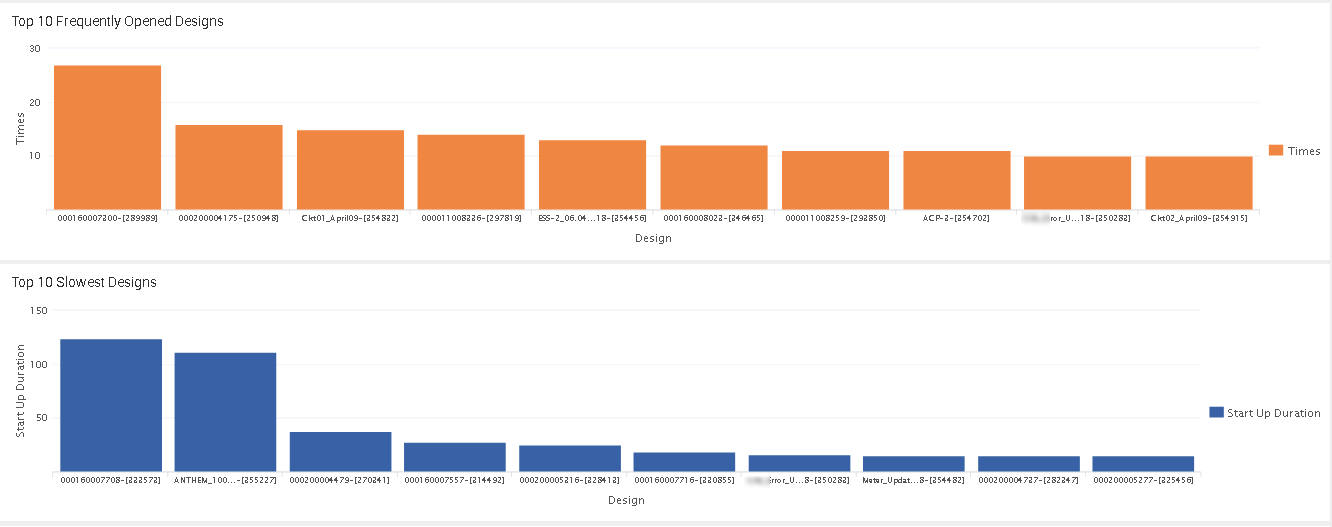
The next screenshot provides some timing details about the opening and use of the designs itself.
Top 10 Frequently Opened designs
The next dashboard gives you insight in the types of projects you use in your design manager implementation that generate failures. Due to the low number of types the dashboard shows less information, but in your particular situation it can be helpful to find out issues in your configuration and user behavior.
Top 10 Business Processes with large State Transition Failures
Quality Manager
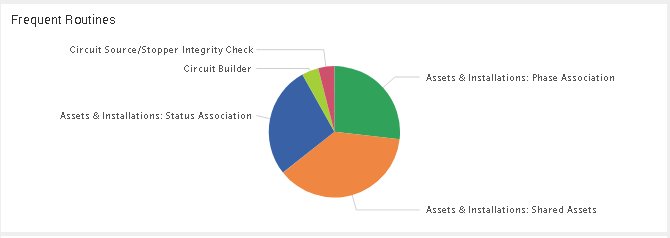
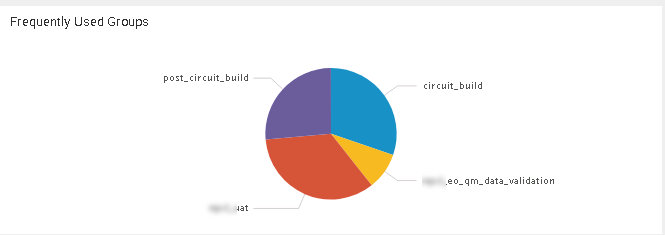
You can organize your Quality Rules in groups. With this module you can get insight in the number of times these group of rules are fired. You can in this way investigate if your Quality is checked enough by the users.
Frequent Routines
Frequently Used Groups
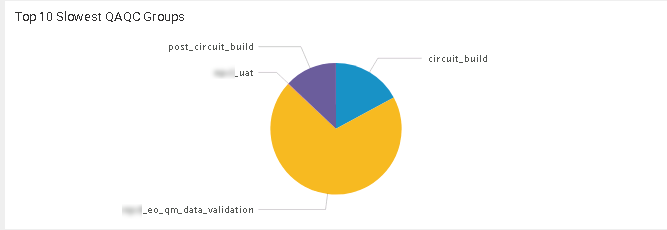
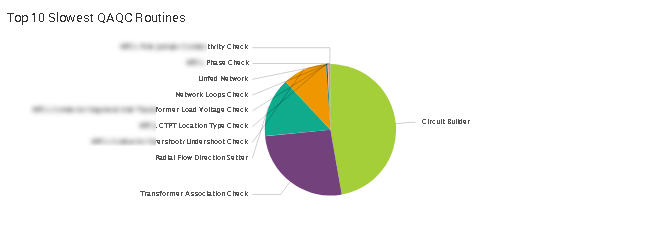
To monitor the usability of your rules you can use the following dashboards that shows the most time consuming rules.
Top 10 Slowest QAQC Groups
Top 10 Slowest QAQC Routines
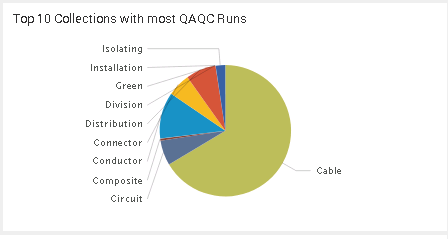
To see the impact of the rules on the quality of your data, you can use the dashboard below. If your important assets are not protected by quality rules you definitely need to improve your quality rules to get a better coverage!
Top 10 Collection with most QAQC Runs
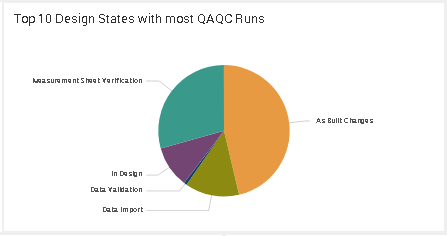
Quality Manager in combination with Design Manager
The combination of QM and DM give you the opportunity to monitor your design process quality. In the end the quality of the added designs and as build works is the most important for your business.
Top 10 Design States with most QAQC Runs
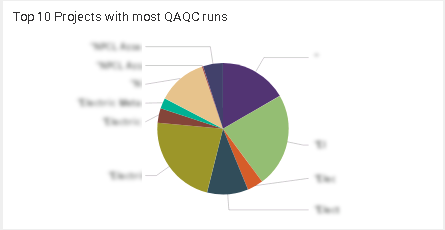
Top 10 Projects with most QAQC runs
If you detect QM is used wrong or Rules need to be added you can gain value on your data by changing rules or business processes.
Supporter: Enexis B.V. (Energy Company); Charles von Harenberg
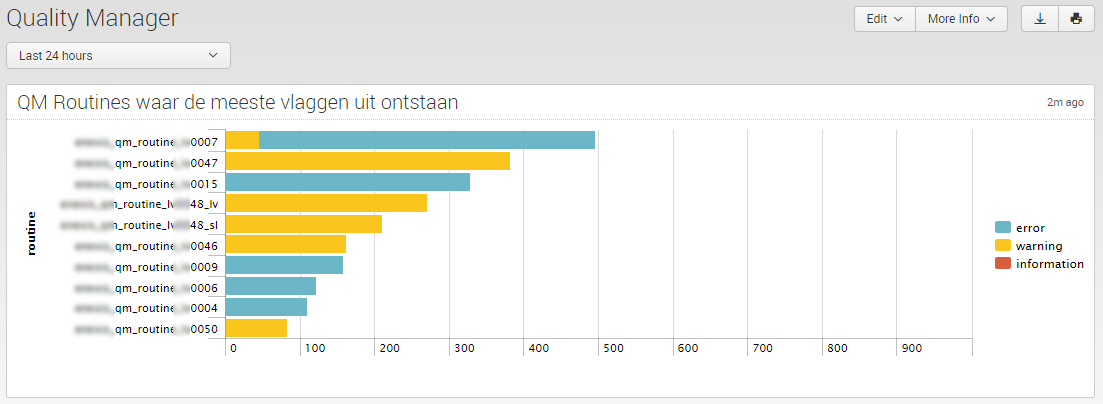
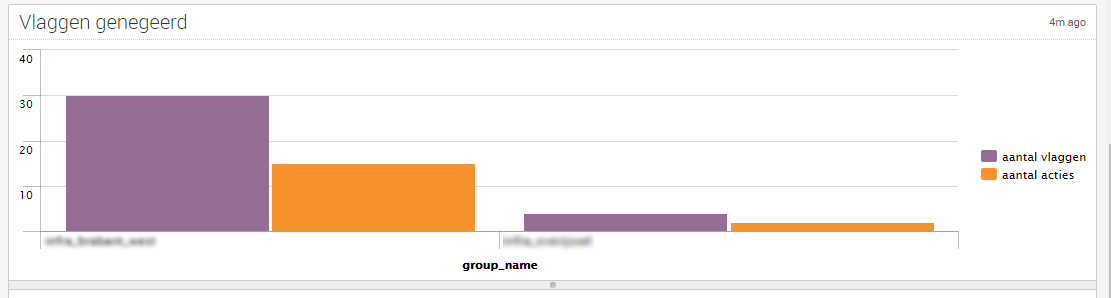
Quality Manager Routines with most generated flags
The Quality Manager generates flags on data issues. These situations are defined in software routines that check your data on certain criteria. This module presents a graph and tables that shows you how many flags each test generates.
This helps you analyze the routines on having too many hits for example. This is all sorted on type of message (Error, Warning or Information).
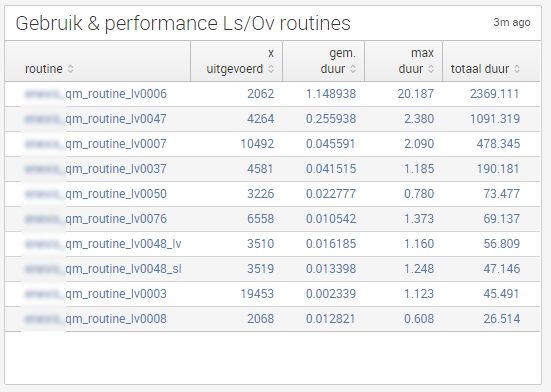
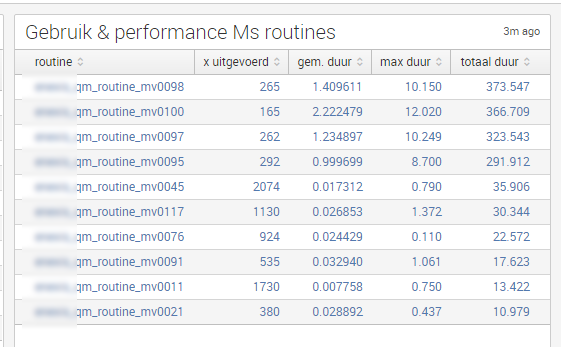
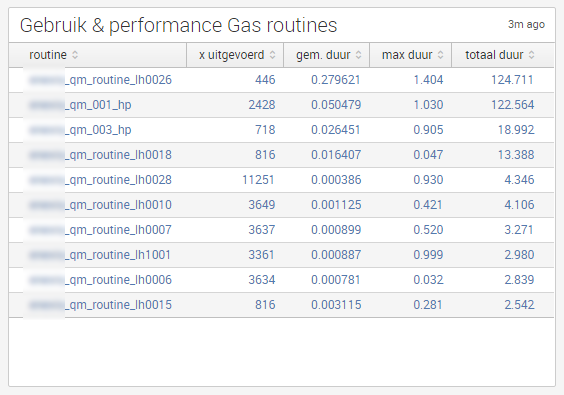
Another view shows you information about groups of routines; you can easily extend or modify this yourself:
Use and Performance of certain types of Routines
Use and Performance of certain types of Routines
Use and Performance of certain types of Routines
The next graph shows you an overview of the number of flags per group. So you can compare the usages of the QM by group.
Number of generated Flags
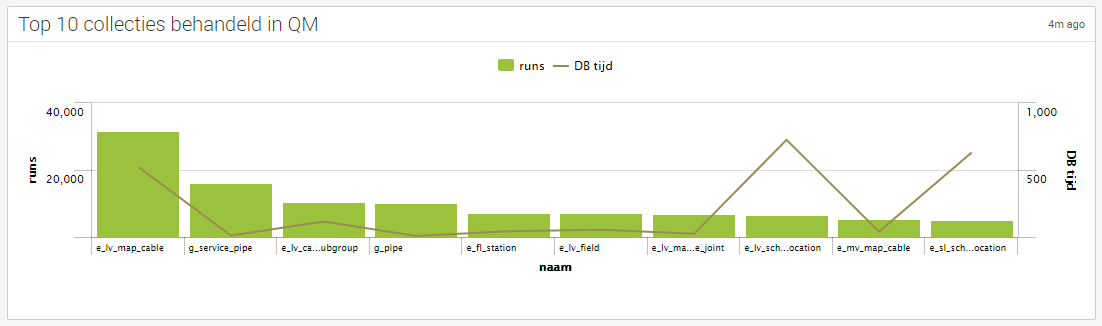
The last graph is an overview of the managed collections by the QM routines. the number of runs on the collection and the time it took.
So the checks on the third collection from the right may need some attention.
Supporter: Enexis B.V. (Energy Company); Charles von Harenberg
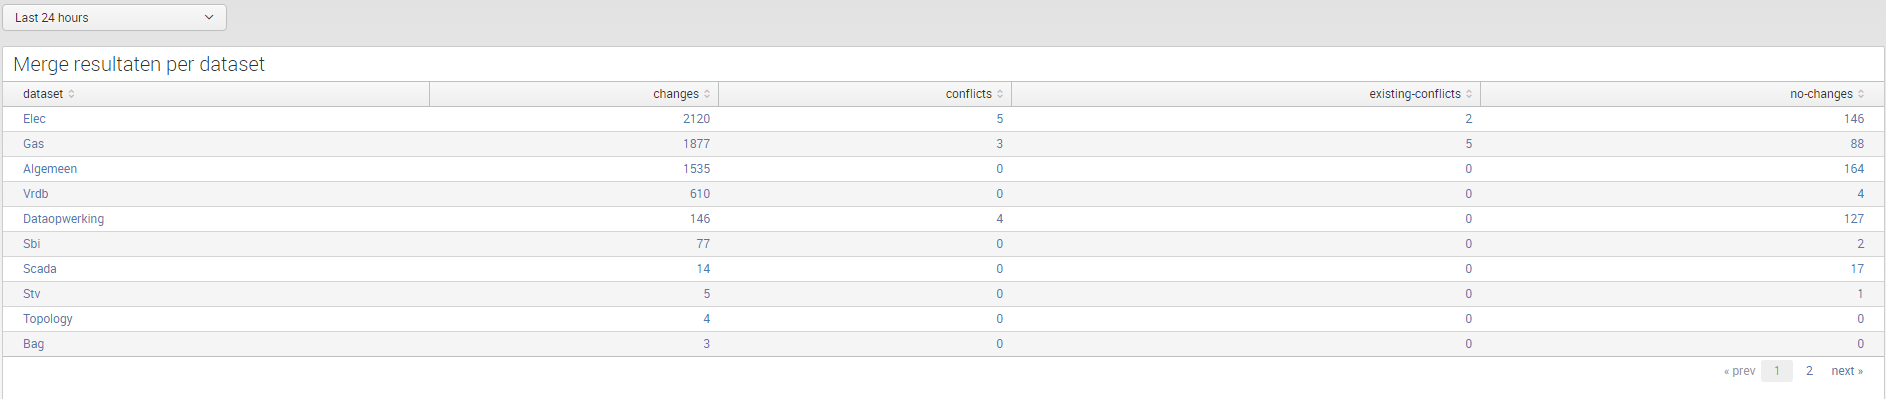
The “Merge and Conflict” module enables you to analyze the success rate of user actions regarding merging and posting in your VMDS. You get an overview of the dataset and all results of the merges. In a merge, it is possible a conflict will arise due to changes of other users of the database. This is normal Smallworld behavior. How are your users dealing with the merge? Do they solve the issues? Do they leave them unsolved?
Top 10 conflict objects
This overview gives insight and the possibility to improve user behavior.
Next to the user behavior, you get information about the kind of objects or tables that are involved. This can help you review your application on unwanted and maybe unnecessary conflicts due to unnecessary changes.