
Supporters: Alexandru Hesson, Arun Venugopal, Koen van Keulen
The SWEG Monitoring Dashboards provide real-time insight into the status of your syncs.
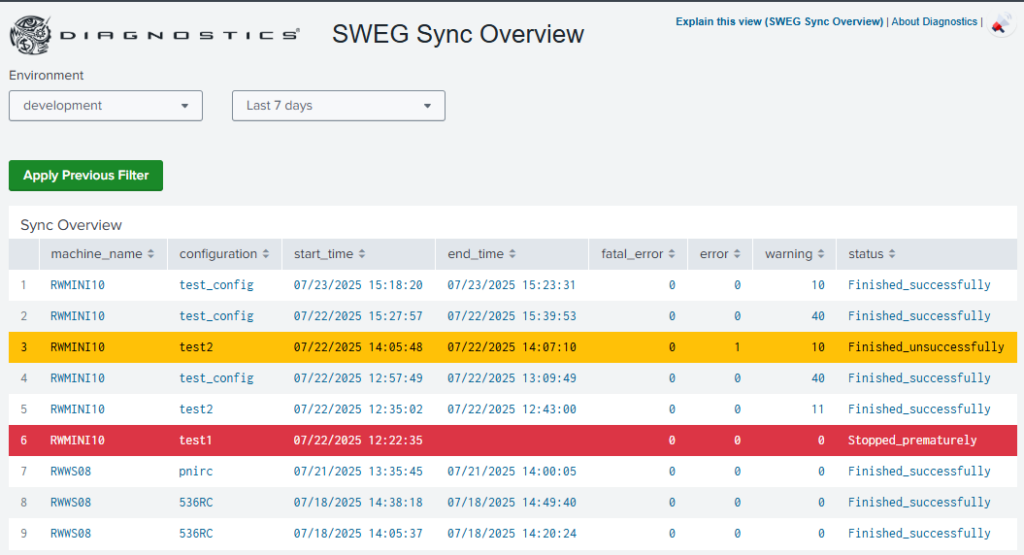
Users can now:
• Monitor ongoing SWEG syncs in real-time
• Access detailed sync history for better tracking and analysis
• Receive instant feedback on sync performance and status
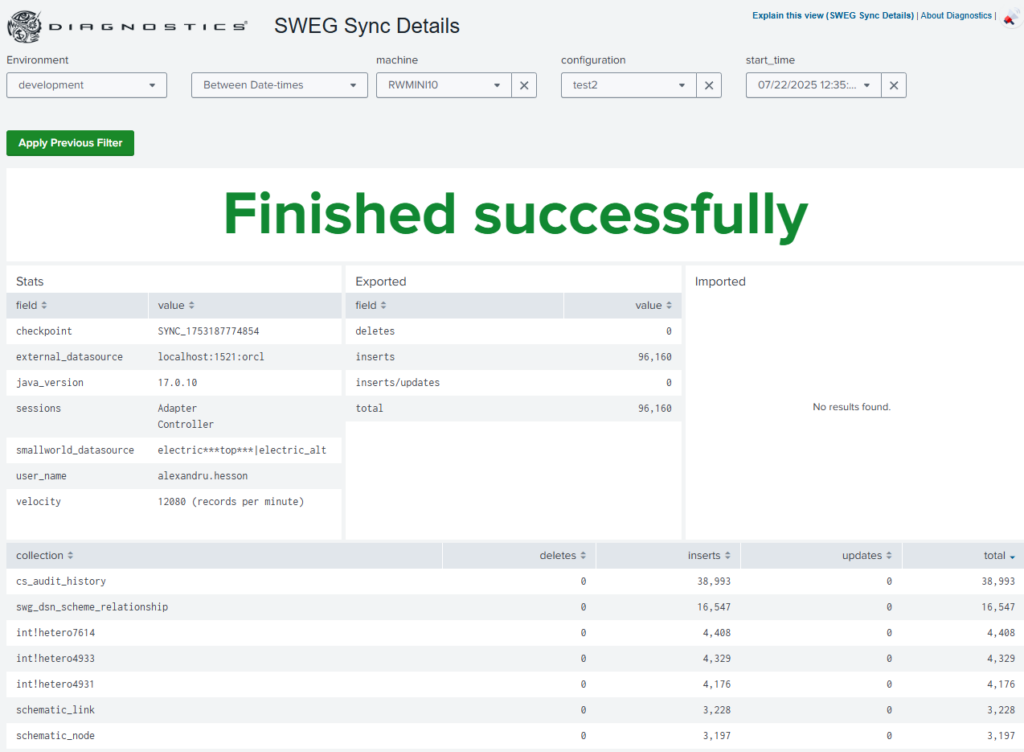
For granular insights, individual SWEG syncs can be examined on the SWEG Sync Details Dashboard. This dashboard provides:
• Additional context to support troubleshooting and analysis
• Detailed sync status
• Number of records and collections synced
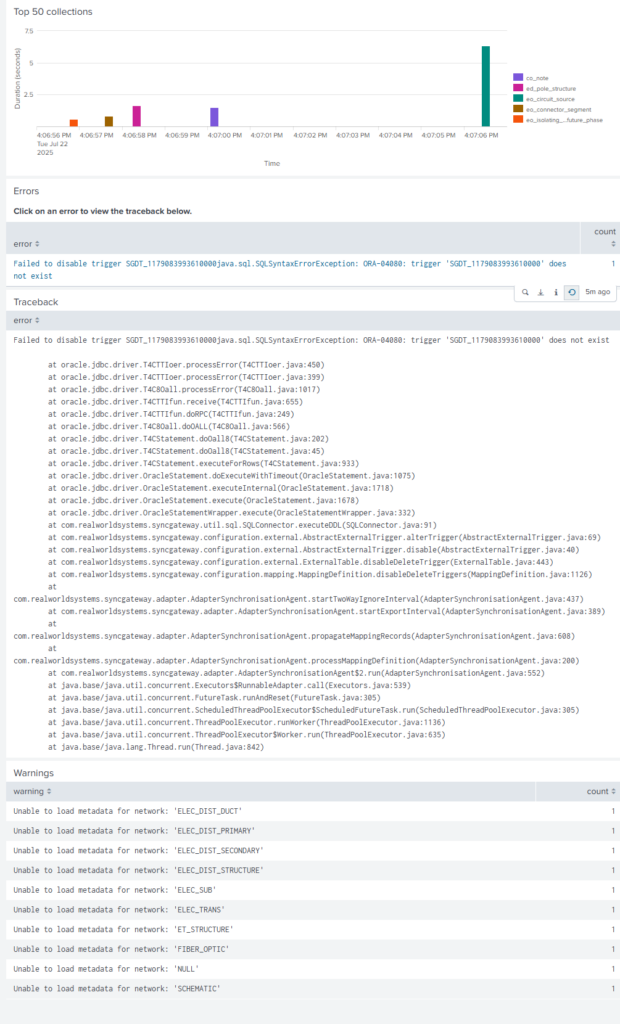
The sync details dashboard also provides more data on any errors or warnings as well as recording the traceback for each of the errors. There is also a chart which shows which collections synced the slowest.
